

The following article was written by Michael Fagin. Fagin is an operational meteorologist providing weather forecasts to clients in the Pacific Northwest and providing custom forecast for groups climbing Mt. Everest and other major peaks. Fagin is also a travel writer with a focus on weather and wine.
The weather rebounded nicely, with above normal temperatures once summer conditions kicked in July and August. Also, the area was spared the heat dome and recording-breaking temperatures that were experienced in 2021.

After such a cool start, the good news for the wine industry in the Northwest is the area experienced a surge of warmer temperatures in late summer and early fall. The map below shows that mean temperatures for August to October were 1 to 3 Fahrenheit above average for Western Oregon (bright yellow colors). However, temperatures were 3 to 5 degrees above average for the wine growing regions of Eastern Washington (dark yellow colors).
What was the main factor contributing to this warming pattern? Starting in mid-August and continuing through the rest of the summer and into the early fall, a ridge of high pressure was set up over the West Coast. The map below is typical of the pattern the area had. The ridge of high pressure (red arrow in the map below) in the upper atmosphere (at 18,000 feet) was anchored over the West Coast. With this type of pattern in place we get warm and dry conditions.

To the east is a trough of low pressure (black arrow in the map below) which tends to bring cooler conditions. The orange colors in the second map represent warmer temperature on the west coast, and the blue colors represent cooler temperatures for the upper Midwest.
This pattern remained in place much of the rest of the summer and into early fall. The pattern finally made a major shift starting on November 1st, when we had cool and wet pattern commence.
2022 Growing Degree Days (GDD)
How did Growing Degree Days (GDD) end up? From the graph below you can see they were below normal for April through almost the end of August for the Red Mountain appellation (green line is average and black line current year). (GDD is a measure of heat accumulation; it is the average temperatures over 50 F from April 1st to October 31st.) Red Mountain finally went above long-term average in August. Meanwhile Yakima Valley (WSU- IAREC Headquarters) went above normal in July. For Walla Walla, it was not until September that the area had above average GDD.

Will it be a wet and cold winter for the Northwest or warm and dry? A seasonal forecast can be difficult to predict, but meteorologists have found some accuracy looking at ocean temperatures in the equatorial waters off South America.
There are two phases; La Niña, which is below normal sea surface temperatures, and El Niño, above normal temperatures. We are currently in a La Niña phase that should be in place through the early part of winter.

Based on statistical data on La Niña phases that have occurred for the Pacific Northwest, more than 50% of the time the upcoming winter will have below normal temperatures and above normal precipitation . The map below shows the typical patterns we have during a La Niña. For the Northwest, above normal precipitation (green colors) extended into Northern California, as did below normal temperatures (blues colors).
Is this pattern good for vineyards in the Northwest? The cooler or cold conditions could be a concern, especially if we get modified arctic air that moves in during the winter that brings some crop damage. However, the positive side is above average precipitation would be welcome, since much of Washington and Oregon wine growing areas are currently in a drought. In Oregon, this drought stretches back to August 2020.
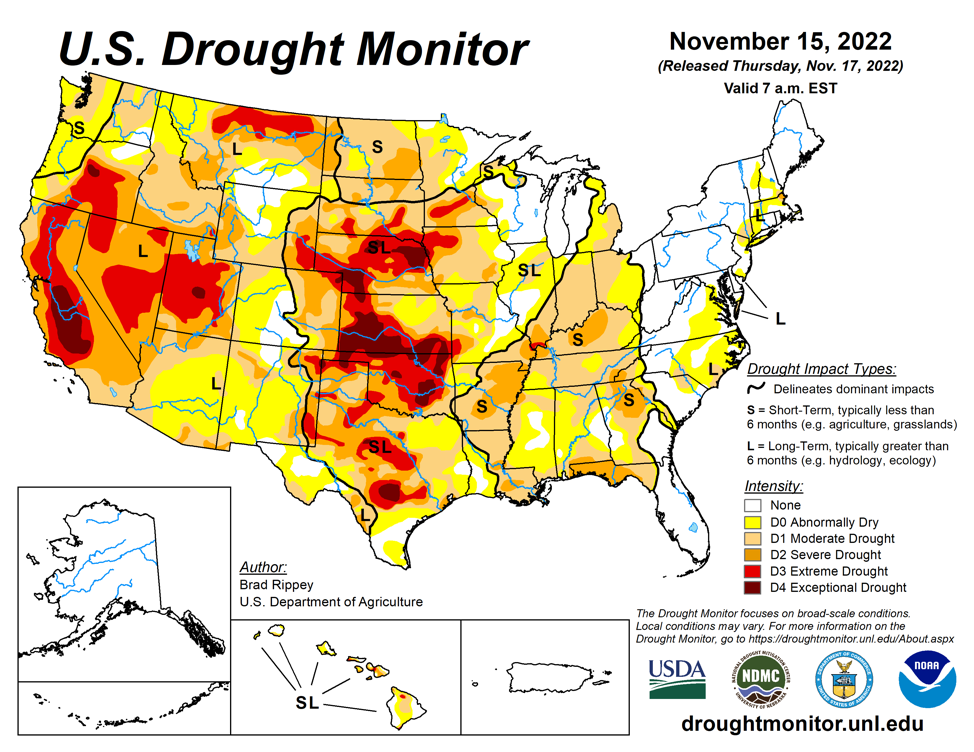
The map at left shows abnormally dry (yellow colors) or moderate drought conditions (slightly darker yellow color), though parts of Oregon are in extreme drought (red colors).
Bottom line, a wet winter would be favorable. A cool – but not too cold – winter would be favorable also, since that would likely provide a good snowpack, thus an above normal spring and summer streamflow.
What is the current winter outlook? The Climate Prediction Center (CPC), part of NOAA, issued their updated outlook on November 17th. The outlook for December through February is that Washington and Oregon will likely have below normal temperatures (blue colors in the map below). The outlook is likely above normal precipitation (green colors) for these regions. If this pattern turns out to be true, this would be welcome news, especially in terms of additional rainfall and mountain snowpack.
.png)


Leave A Comment